


The CopernicusLAC Centre Panama continues to advance the co-development of Earth observation services to strengthen disaster risk reduction capabilities in Latin America and the Caribbean. Between February and March 2026, two new co-development initiatives were launched:
- Flood Hazard Mapping
- Population Distribution Mapping
These services have the potential to deliver high-value services to hydrometeorological institutions, civil protection agencies, spatial planning bodies, and geospatial information centres across the region.
Flood hazard mapping (Use case #4)
The Flood Hazard Mapping Service integrates Earth Observation data derived from Sentinel-1 satellites with the hydrological modelling of the Copernicus Emergency Management Service’s Flood Global Awareness System (GloFAS). The aim is to generate refined flood hazard maps (with 90-metre resolution) by combining two types of information. Data from historical flood records are used, including their frequency and depth as observed by satellite, along with hazard estimates based on global hydrological models, which calculate expected flow rates for different return periods. The integration of both sources allows for a more accurate representation of where and with what probability floods might occur. The map in Figure 1 shows the flood hazard in La Mojana, Colombia, according to different return periods (RP). The cyan colour represents areas subject to relatively frequent flooding (2-year return period), whereas the red colour indicates regions affected by extreme flooding events (500-year return period).
Technical note: The return period (RP) describes the likelihood of a flood event of a given magnitude, expressed as an annual probability of occurrence. For example, a 10-year return period corresponds to a 10% probability of occurrence in any given year, whereas a 500-year return period corresponds to 0.2%.
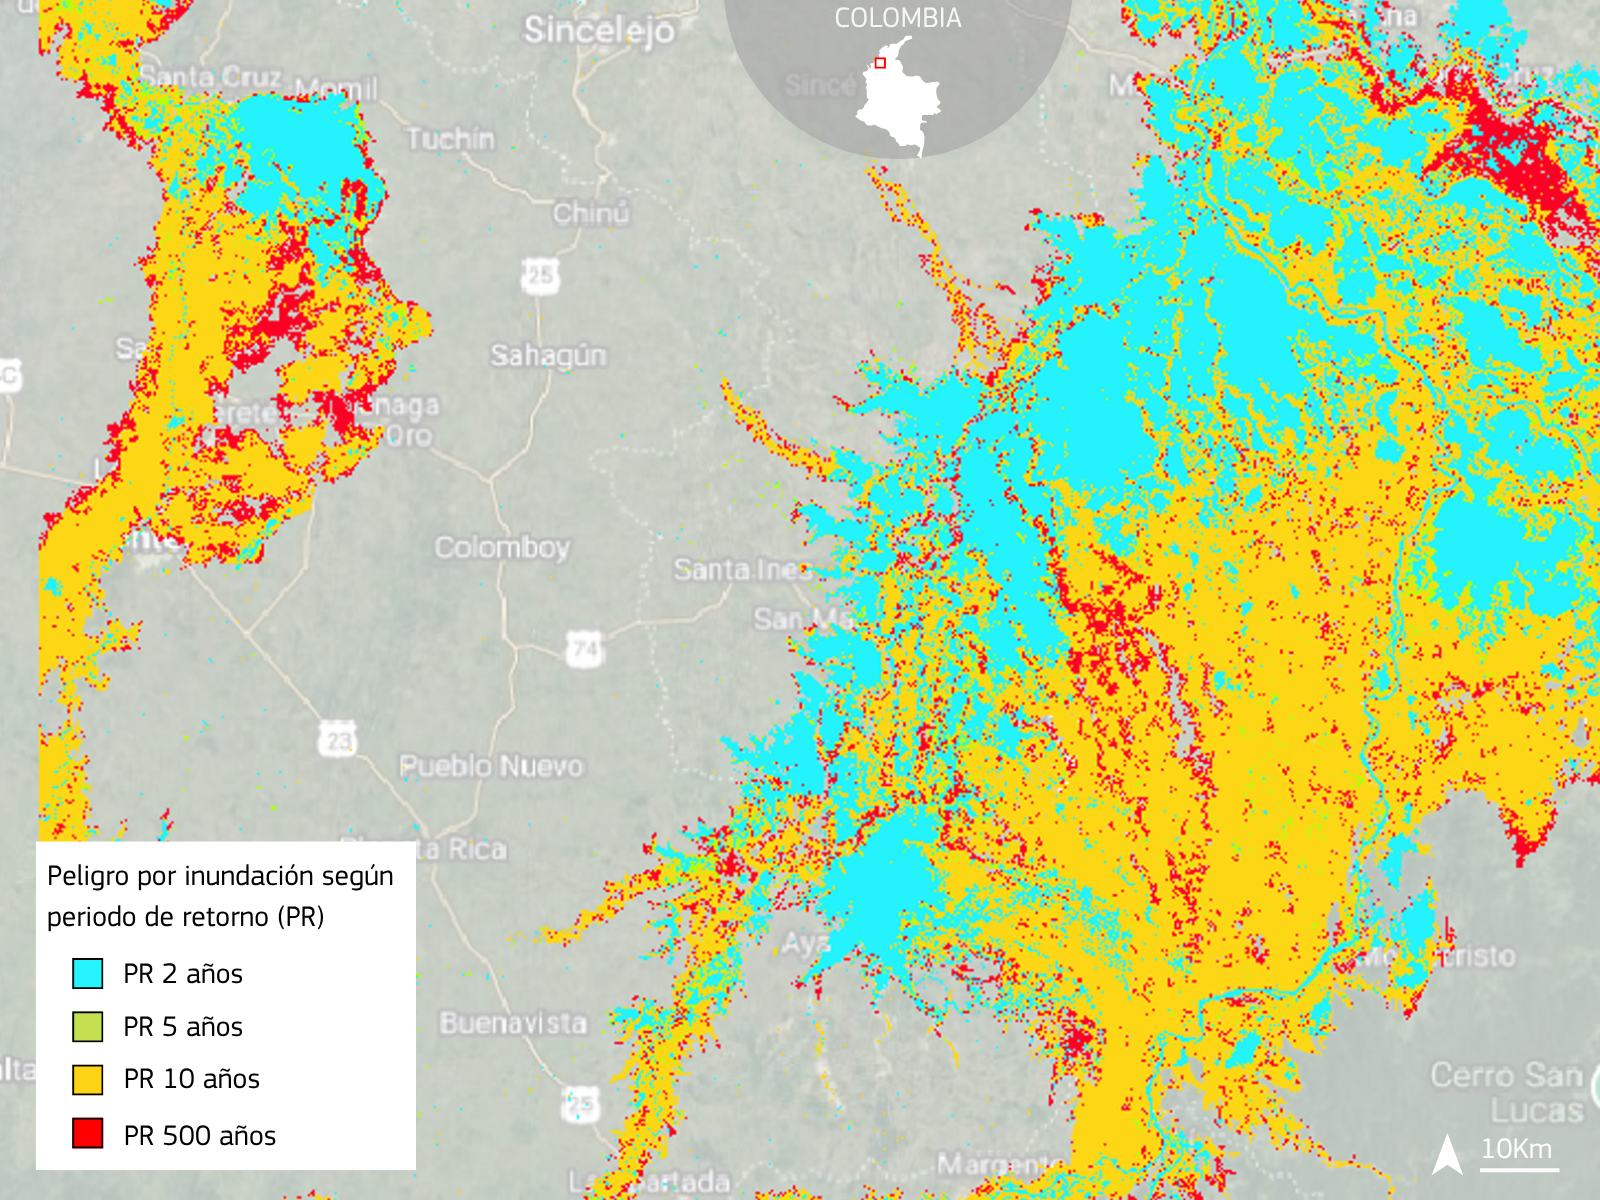
Figure 1: Flood hazard map for La Mojana (Colombia). Derived from flood extent data by GloFAS Global Flood Monitoring (GFM). Credits: CopenicusLAC Panama Centre
The operational demonstration will cover the river basins of Central America and the Pacific basins of Colombia, Ecuador and Peru, where risk management institutions and hydrometeorological agencies will act as key users in the co-development of the service. As part of the launch, introductory meetings have already been held with broad institutional representation, including national agencies from Guatemala, Honduras, Colombia, El Salvador and Peru, as well as the Inter-American Development Bank (BID). The collaborating entities will provide contextual knowledge and contribute to the adaptation and validation of the service to meet the region’s needs.
This service will enable the identification of areas most prone to flooding using field information and historical data. Furthermore, it will allow for the assessment of assets at risk through integration with exposure databases, and the estimation of potential economic and building-level damage based on flood depth calculations. Co-development with end-users ensures that the products are tailored to the region’s needs and are fully operable.
Population Distribution Mapping (Use Case #11)
In parallel, work has begun on developing the Population Distribution Mapping service, as part of the CopernicusLAC Centre’s Exposure theme. This service applies artificial intelligence techniques and combines multiple layers of open data with the DLR’s World Settlement Footprint (WSF) products. Using these inputs, the system generates maps of populations potentially exposed to natural hazards, both systematically and on demand, achieving resolutions of up to 10 metres. Furthermore, it allows users to input their own population data to obtain estimates better suited to specific regions.
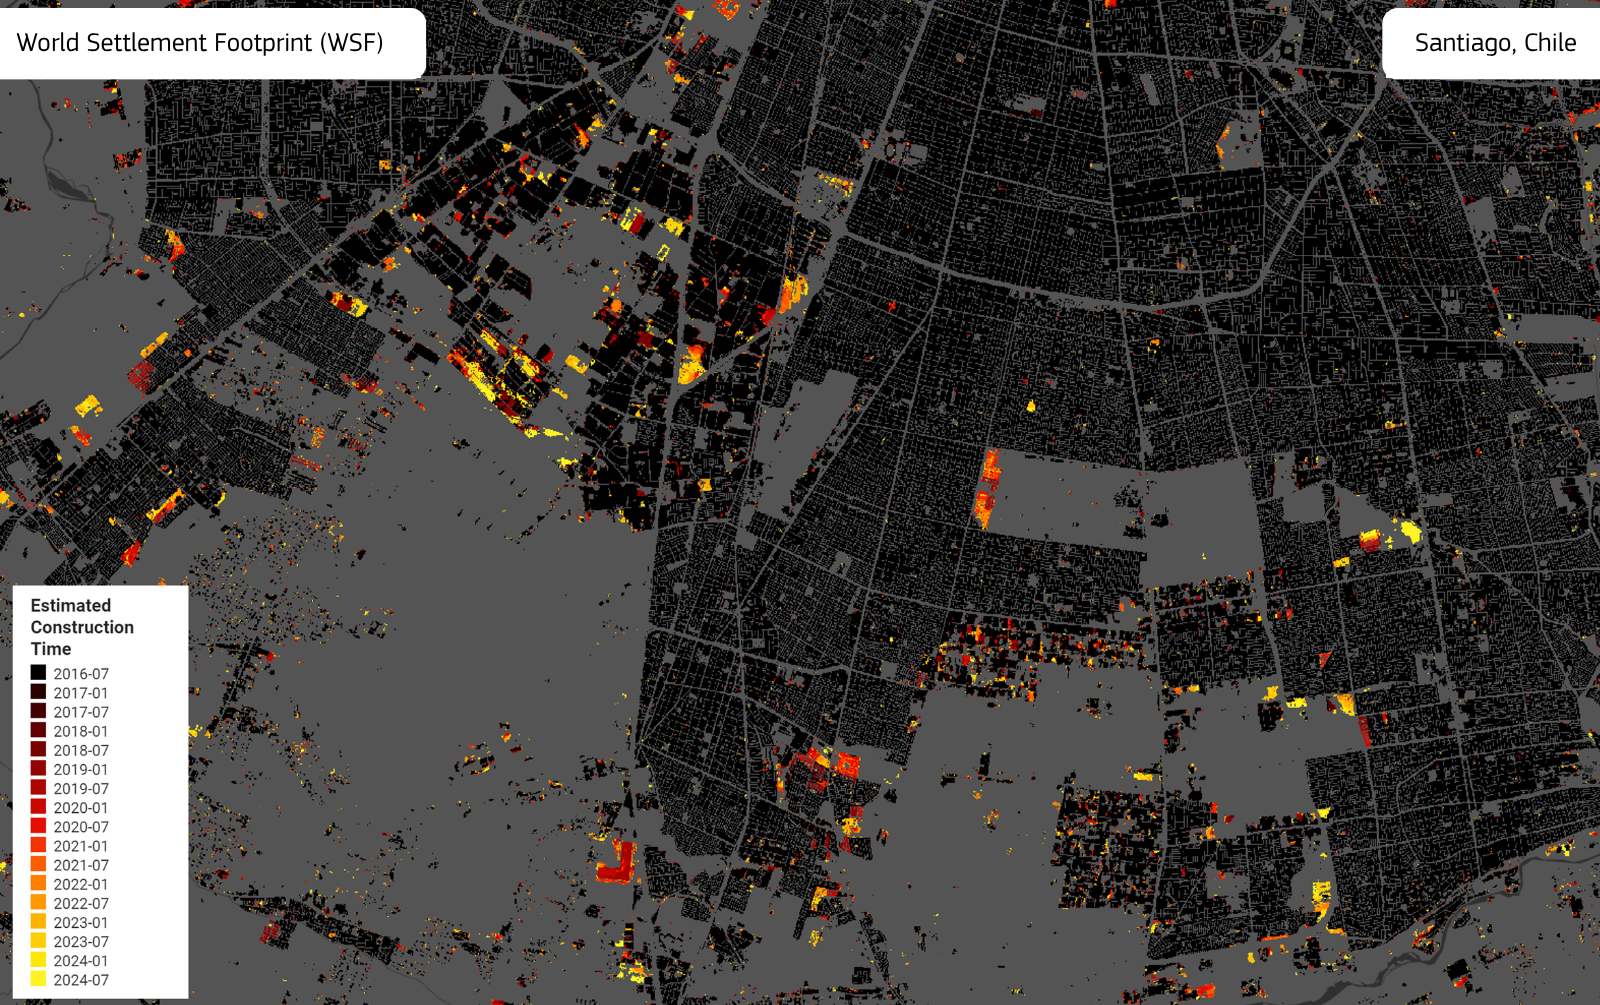
Figure 2: Population expansion map (WSF Tracker) of Santiago, Chile. The black areas show buildings existing prior to July 2016, the orange and dark red areas correspond to buildings constructed between 2016 and 2024, and the yellow areas represent the most recent constructions within that period. Credits: DLR.
User roles and activities
The institutions involved in the co-development of the services will play a key role in ensuring that the services are useful, applicable and fully adapted to the regional context. Their main activities include:
- Providing functional and operational requirements, ensuring that the final services meet the actual needs for risk monitoring and management.
- Providing iterative feedback during demonstrations and proof-of-concept testing.
- Assessing the usability and usefulness of the products, verifying their suitability for existing workflows.
- Carrying out technical testing and validation, including comparison with local data where available.
- Identifying opportunities for institutional adoption, facilitating the integration of the new services into national or regional decision-making processes.
This collaborative approach ensures that the final results are not only technically sound but also operationally relevant, sustainable in the long term and directly usable by risk management institutions in the region.