


Use Case 11 focuses on the systematic production of geospatial information describing urban land and population distribution, with particular emphasis on rapidly expanding cities. The use case provides detailed layers characterising population density, building height, built‑up area expansion and surface imperviousness, supporting evidence‑based urban planning and disaster‑risk management.
Population information is delivered through a combination of World Settlement Footprint (WSF) geospatial layers and the Population Distribution service. The service integrates WSF Tracker (urban extent and settlement dynamics), WSF 3D (building‑height information) and WSF Imperviousness (sealed surfaces). These inputs are used within a machine‑learning‑based redistribution framework to spatially disaggregate population totals and generate high‑resolution population maps up to 10 m, available as raster layers (persons per pixel) and, where applicable, at building level.
The workflow is designed to be flexible with respect to population inputs. Users may provide their own population totals at national, regional or administrative level; when local data are not available, census information or internationally recognised estimates are used. Population layers are updated periodically as new WSF datasets are released and can also be recomputed on demand to address specific scenarios or planning needs.
The use case is demonstrated in urban areas experiencing strong expansion in Peru, Ecuador, Chile, Brazil and Panama, where accurate and up‑to‑date population information is critical. The resulting products support urban planning, emergency management, disaster preparedness and resource allocation, particularly in densely populated areas and informal settlements, providing institutions with a consistent and detailed view of population exposure in dynamic urban environments.
Area of application: rapidly growing urban areas in Peru, Ecuador, Chile, Brazil and Panama
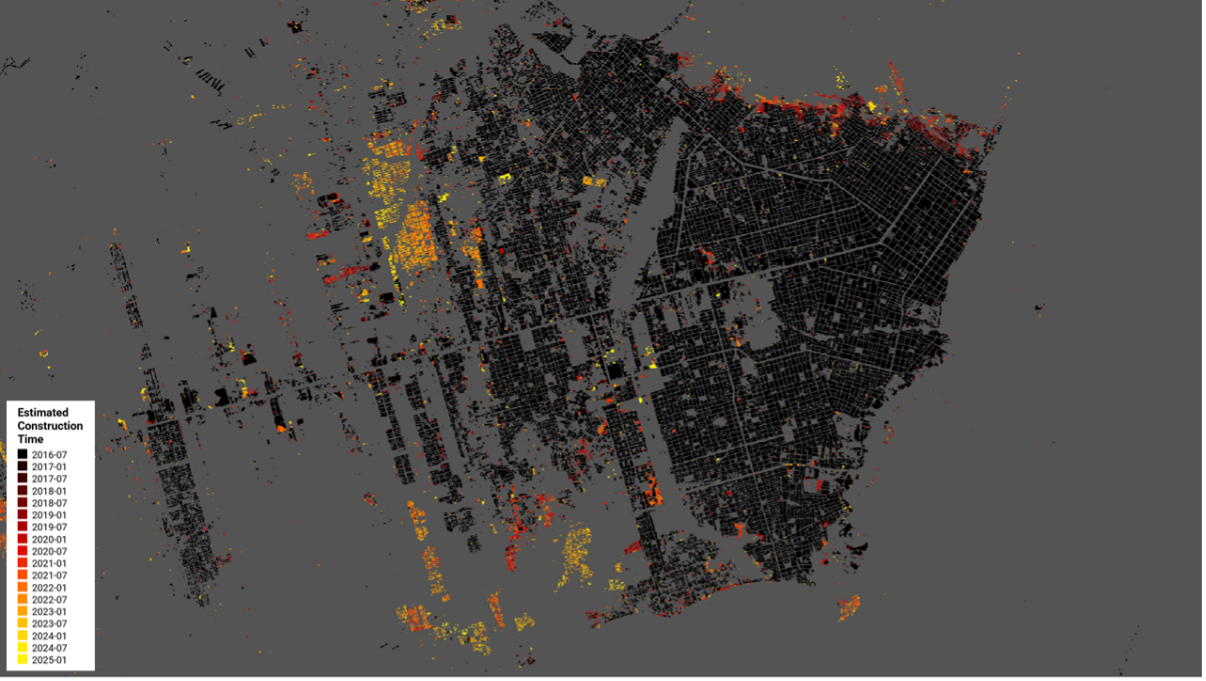
Example of the WSF Tracker in Pucallpa (Peru), showing the growth in built-up area over a six-month period with a spatial resolution of 10 m, from July 2016 to January 2025. Credits: DLR.