





For the Hydrometeorological hazards theme, the CopernicusLAC Platform provides a suite of Earth Observation services designed to support disaster risk management through the detection, monitoring, and analysis of water-related extremes. Leveraging high-resolution data from the Copernicus Sentinel satellites, these services offer timely and actionable insights into both ends of the hydrological spectrum: floods and droughts.
Flood Extent Mapping
Flood Extent Mapping provides on-demand flood delineation for individual flooding events using satellite imagery.
The service is available in two complementary variants: a simplified SAR-based service relying on Copernicus Sentinel-1, and an advanced multi-sensor service that combines Sentinel-1 and Sentinel-2 data to derive refined flood extent products. Both variants deliver event‑based flood maps at high spatial resolution and are designed for flood monitoring, preparedness and risk assessment.
Products include classified flood‑extent maps for specific flooding events, together with a maximum flood‑extent layer derived from the combination of all available observations within a defined time window.
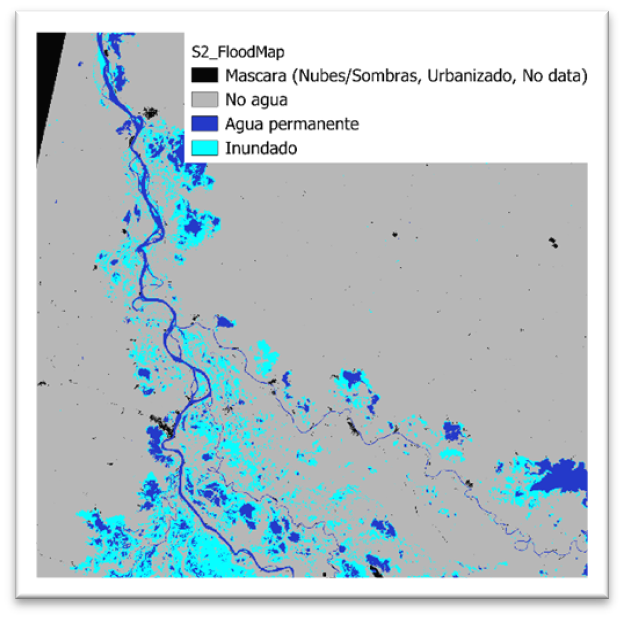
Example of S2-derived flood extent map. Legend: masked (e.g. no data), no water, permanent water, floodwater.
Advanced Flood Extent Mapping service
...
Simplified Flood Extent Mapping service
...
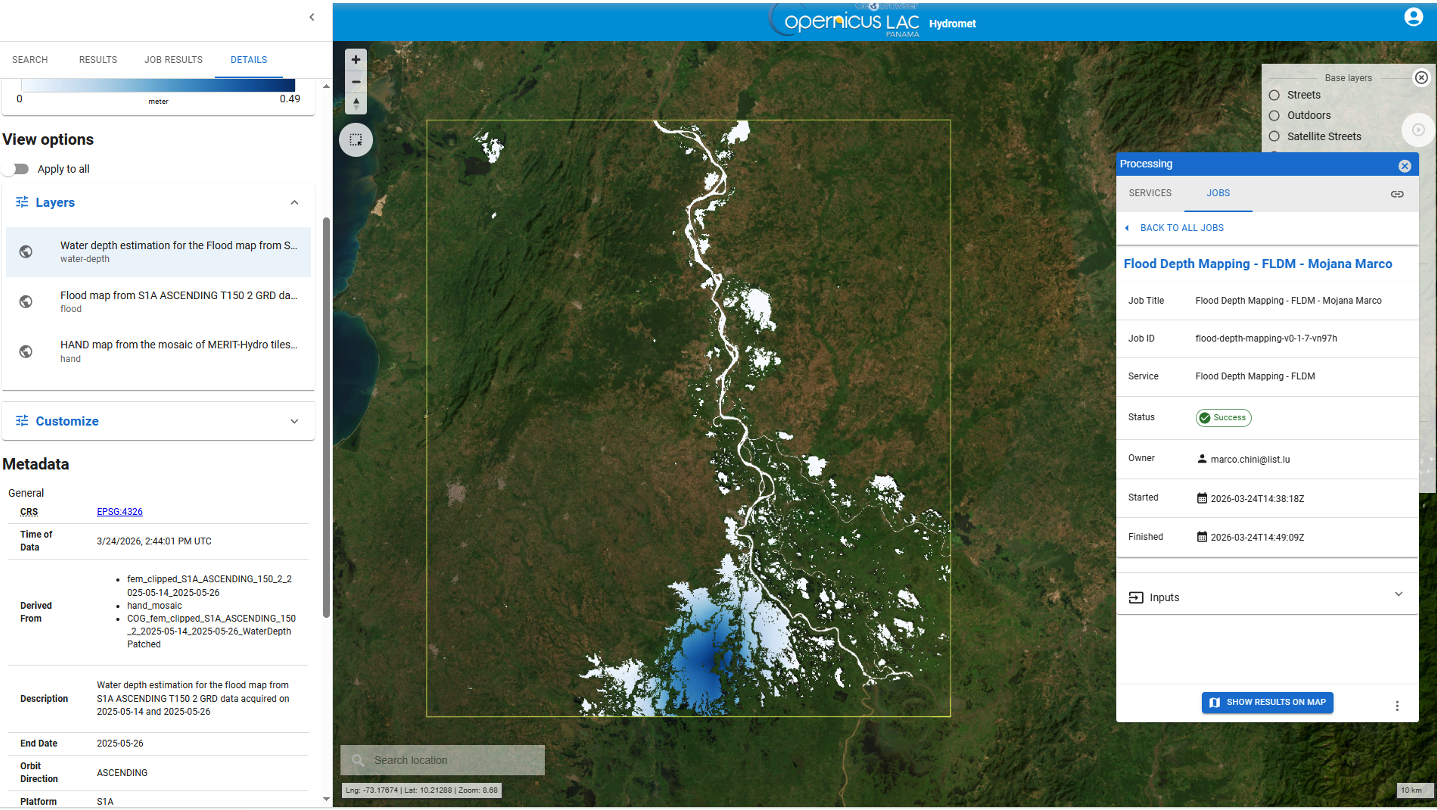
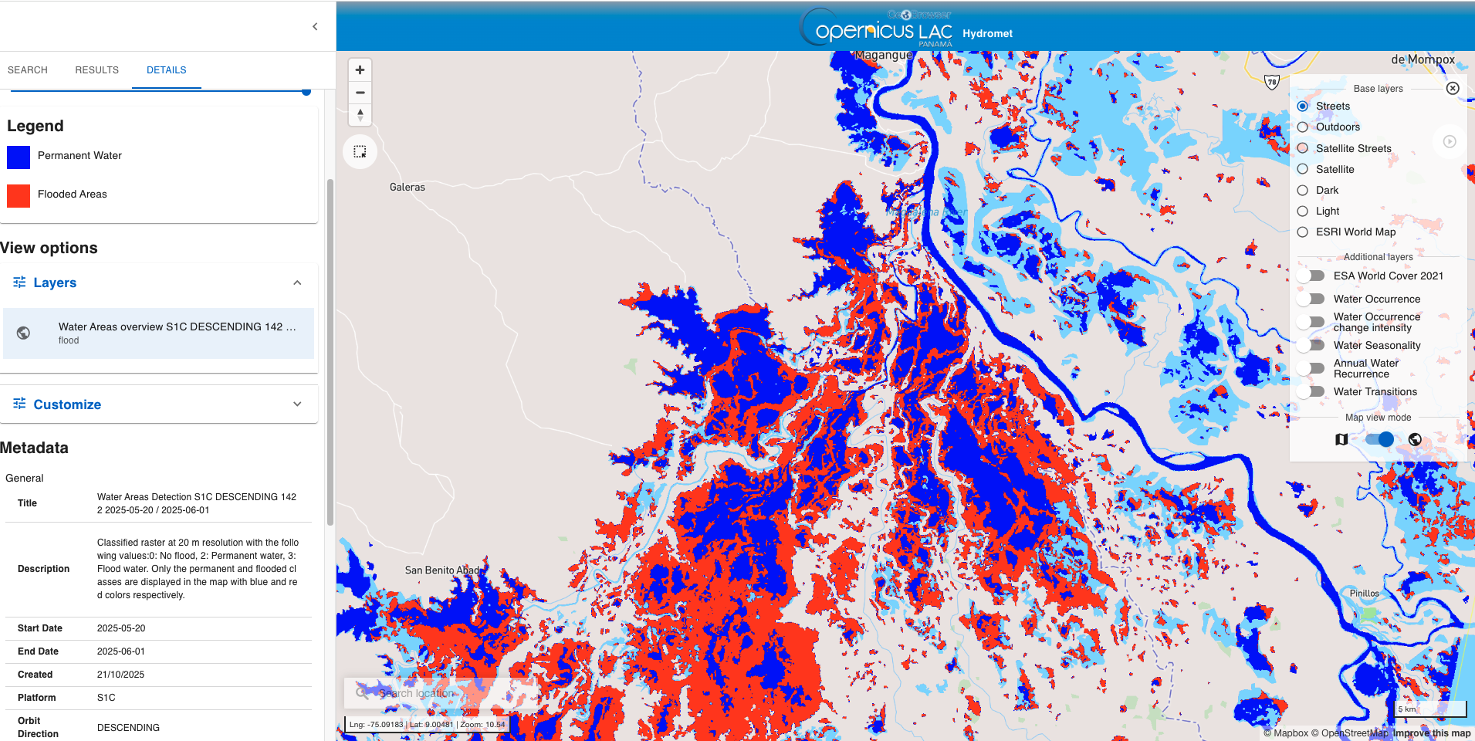 Example of SAR-FEM execution over la Mojana (Colombia) in the CopernicusLAC platform.
Flood Frequency Mapping service
Flood Frequency Mapping provides on‑demand estimation of how often an area has been affected by flooding over a user‑defined time period, based on satellite‑derived flood‑extent maps. The service is available in two complementary variants: an advanced multi‑sensor service combining Sentinel‑1 and Sentinel‑2 data, and a simplified SAR‑only service relying exclusively on Sentinel‑1 imagery.
Both variants generate empirical flood‑frequency maps at 20‑metre spatial resolution, expressing how many times each pixel was detected as flooded within the selected time range. These products support flood‑hazard analysis, preparedness activities and risk assessments.
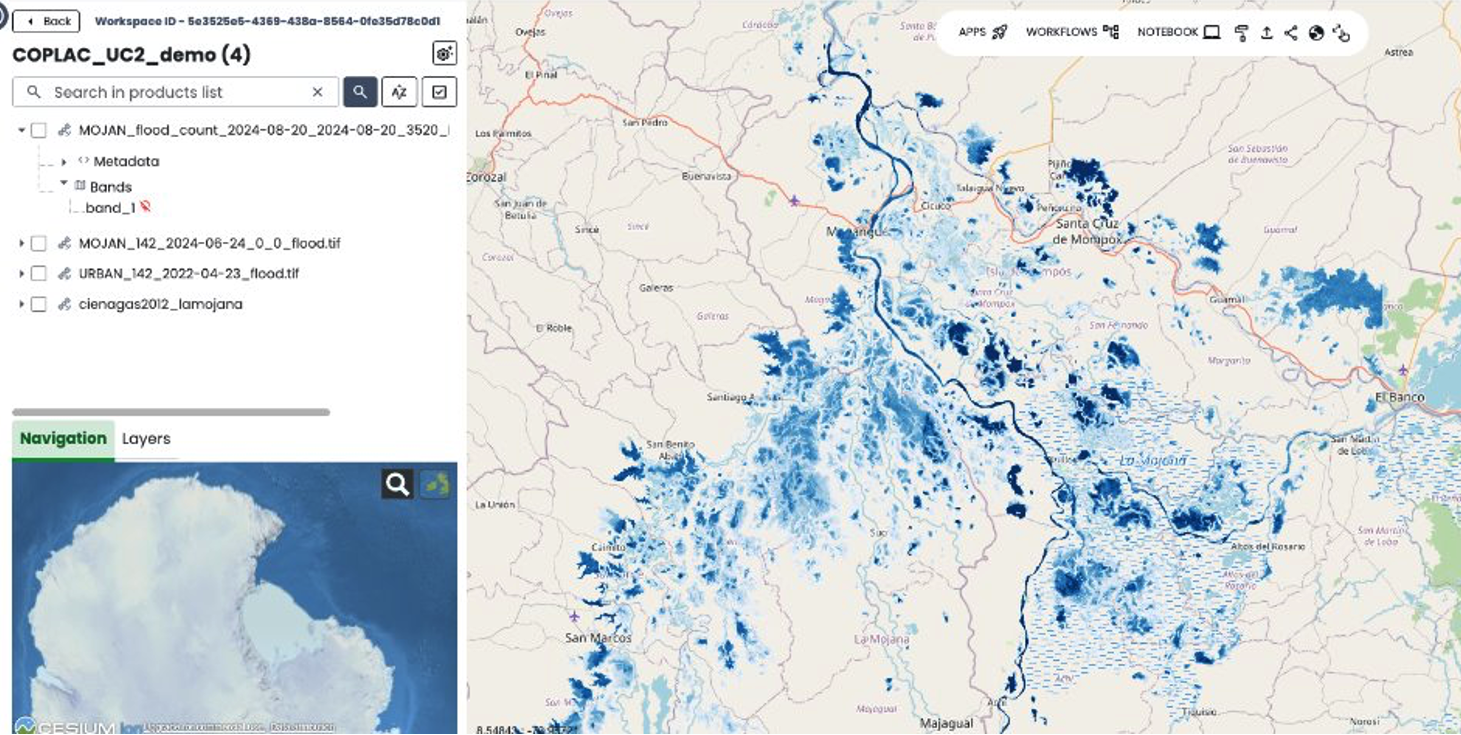
Example of flood-frequency map between 2015 and 2024, extracted over la Mojana (Colombia) with the advanced Flood Frequency Mapping service. Darker blue shades indicate higher flood frequency
Advanced Flood Frequency Mapping service
...
Simplified Flood Frequency Mapping service
...
Flood Depth Mapping service
Flood Depth Mapping provides on‑demand estimation of maximum flood‑water depth by combining satellite‑derived flood‑extent information with elevation data. The service produces per‑pixel water‑depth maps that complement flood‑extent products and support risk assessment, impact analysis and emergency response.
The service is available in two complementary variants—an advanced service and a simplified service, which share the same inputs, outputs and user interaction, differing only in internal optimisation approaches. For operational users, both variants provide equivalent results and workflows.
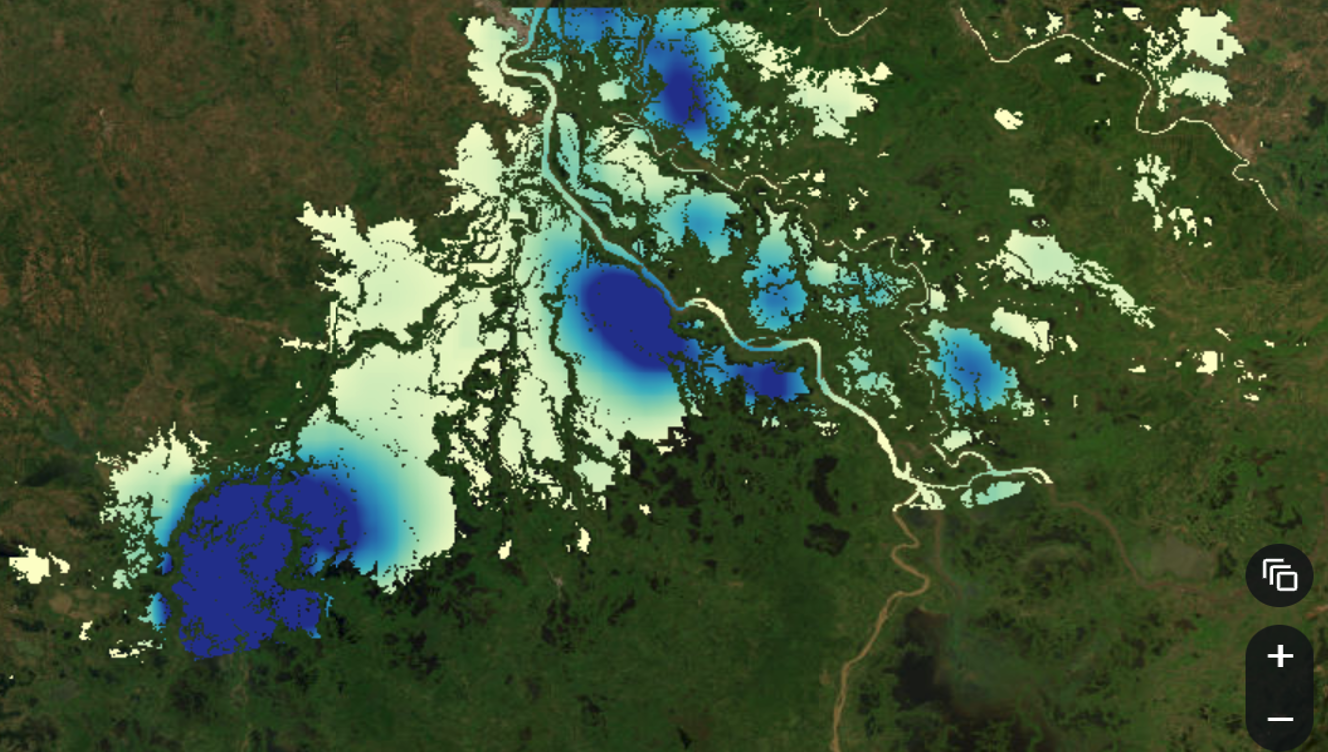
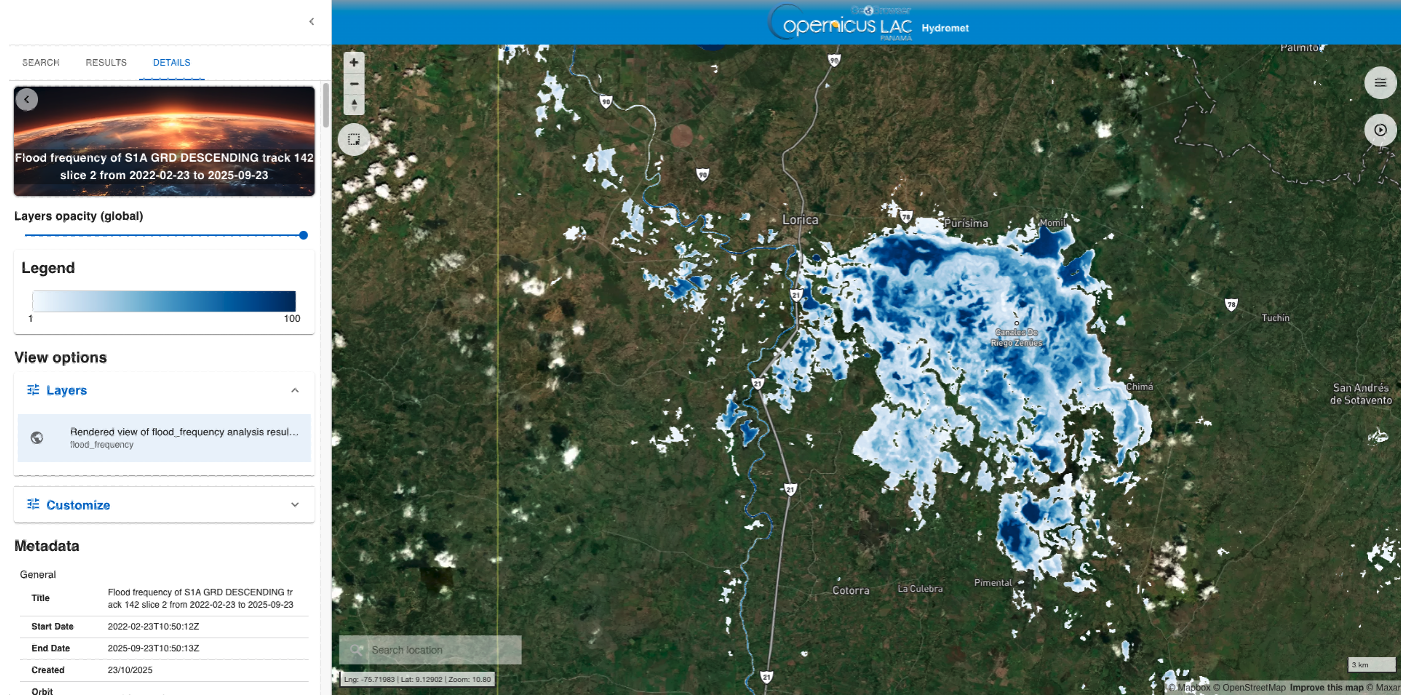
Example of water‑depth map per pixel, extracted with the advanced service over la Mojana (Colombia). Darker shades of blue indicate deeper water.
Advanced Flood Depth Estimation service
...
Simplified Flood Depth Estimation service
...
Flood Hazard service
Flood Hazard Mapping provides on‑demand characterisation of flood hazard by combining satellite‑derived flood frequency information with hydrological and hydraulic model outputs. The service produces a new set of flood‑hazard maps that integrate observed flood behaviour with modelled flood dynamics, improving the representation of flood‑prone areas and expected flooding patterns.
The service is available in two complementary variants: an Advanced Flood Hazard Mapping service, built on multi‑sensor flood‑frequency products, and a Simplified Flood Hazard Mapping service, based on SAR‑derived flood‑frequency information. Both variants share the same purpose and outputs, differing only in the underlying flood‑frequency inputs used.
Advanced Flood Hazard Mapping service
...
Flood Hazard Mapping service
...
Drought Indices Service
The Drought Indices service combines information on precipitation, soil moisture and vegetation state to derive integrated drought monitoring products (Standardised Precipitation Index (SPI), Soil Moisture Anomaly (SMA) and FAPAR anomaly) and a Combined Drought Indicator (CDI). The service adapts the EDO/GDO-CEMS methodology to the LAC context. The products are produced at a spatial resolution of 1km-5 km.
The benefits of the service include integrated drought monitoring, enhanced interpretation of potential impacts on agriculture and vegetation and support for early warning and decision-making.
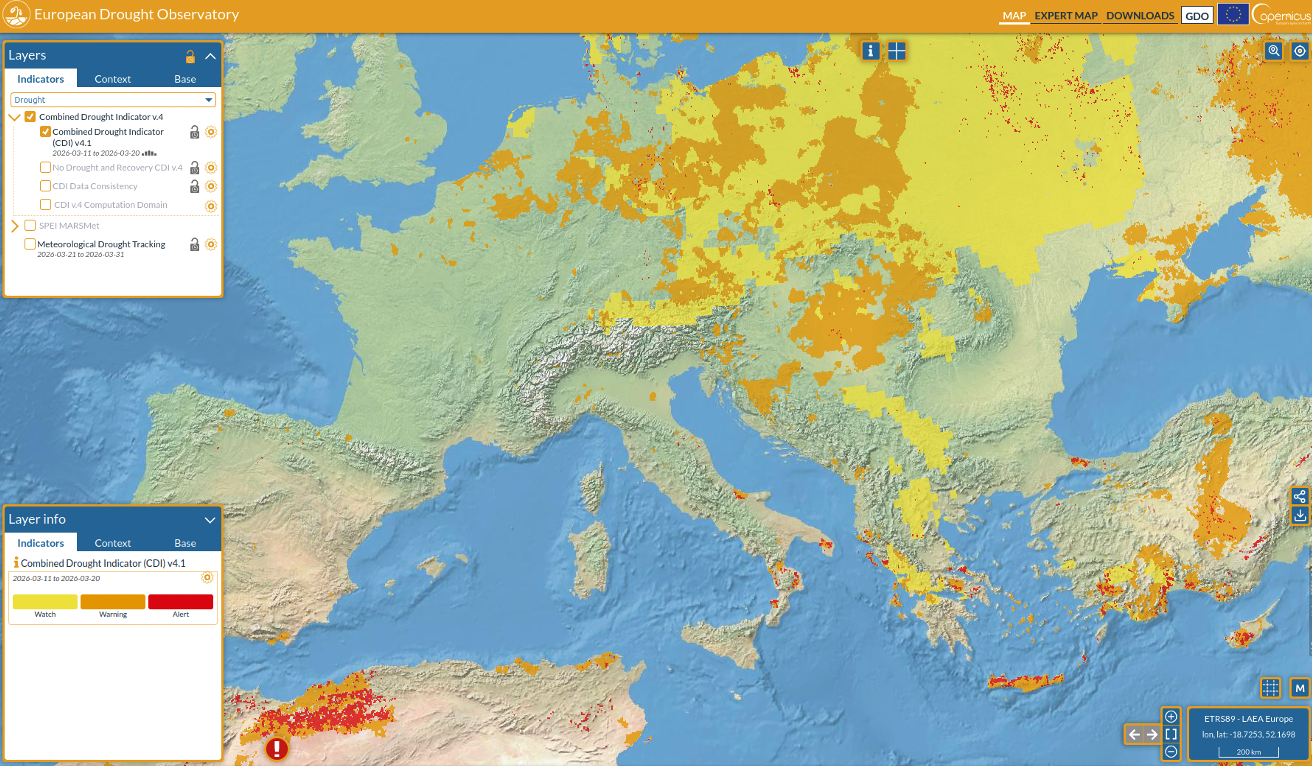
Combined Drought Index over Europe and Northern Africa. Credits: European Drought Observatory, Copernicus Emergency Management Service.
SAR Features Service
The SAR-Features service provides on demand a detection of changes using advanced SAR-derived products from two Sentinel-1 SLC image pairs acquired before or after an event. The SAR Features service employs coherence and backscatter derived with the SAR-COIN processor to provide an estimation of detected changes from a multi-temporal image stack of SAR-derived images from the Copernicus Sentinel-1 mission.
Three application scenarios are considered: identification of damaged structures after earthquakes or tropical cyclones, the mapping of floods in bare soil and built-up areas and other disaster type or impact such as landslides over bare soil. Outputs include false colour composites, classified rasters as change/no-change and more advanced products in the case of the flood scenario (urban flooding, bare-soil flooding, permanent water).
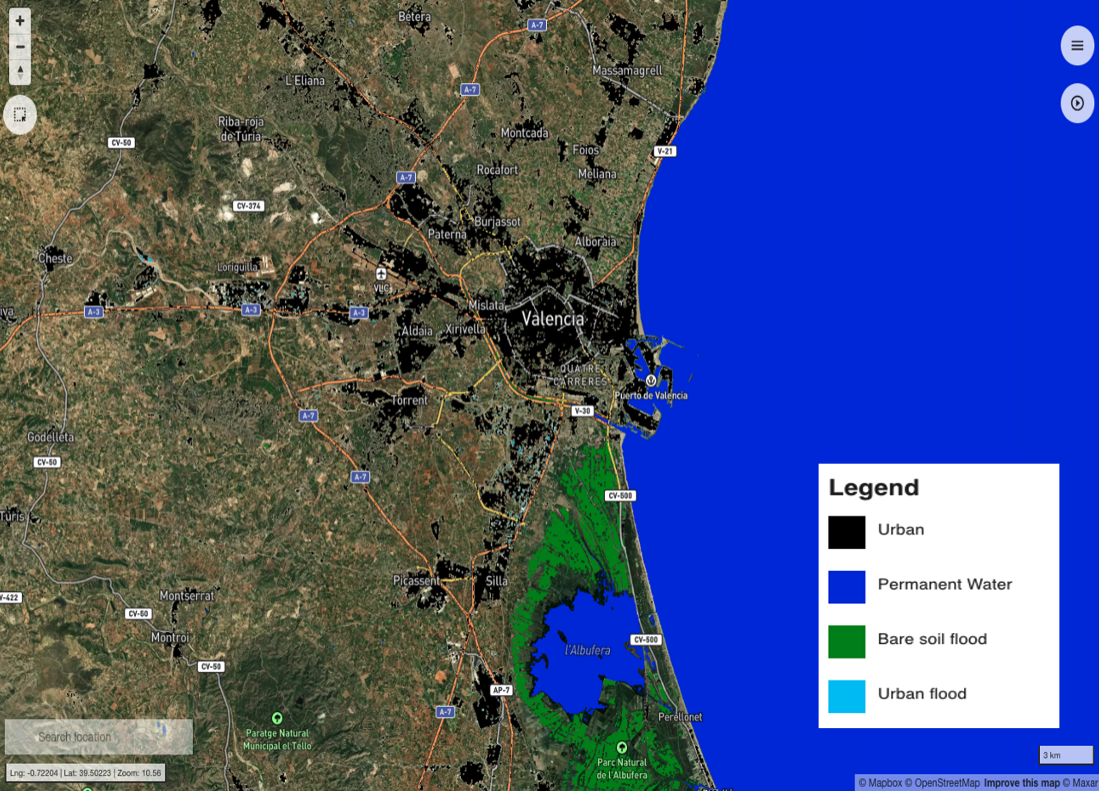
Example of SAR Features classified raster of the flood scenario after the DANA October 2024 event in Valencia (Spain). Classes included: permanent water, bare soil flood, urban flood and urban areas.
Flood Impact service
The service generates flood impact assessments for agricultural areas by combining high-resolution flood observations from the Copernicus Sentinel-1 satellite, obtained through the Flood Extent Mapping (FEM) service, with the agricultural stock map produced by the Economic Value Mapping (EVM) service, which estimates the economic value of harvested or stored crops in USD/m². In its simplified configuration, the service combines the flood extent map and the agricultural stock layer to estimate the affected hectares and potential economic loss. When the user provides additional auxiliary data, such as crop maps and agricultural calendars, a more complex, vulnerability-informed impact assessment is performed, allowing for estimates of yield losses and economic damage by crop type.