


Use Case 2 demonstrates how automated satellite‑based services can support continuous monitoring of flooding conditions and the assessment of potential impacts. The workflow is built around the Flood Extent Mapping (FEM) service, which delineates flood extents from Sentinel‑1 and Sentinel‑2 imagery using change‑detection approaches. For this use case, FEM is run automatically as new satellite acquisitions become available, generating monthly flood‑extent maps that consistently characterize recent flooding events over the area of interest.
Building on these outputs, the Flood Frequency Mapping service performs systematic, long‑term analysis by repeatedly executing FEM over a defined temporal window. The resulting flood‑frequency maps, updated every six months, express for each pixel the proportion of observations in which flooding occurred, providing an empirical measure of flood likelihood over the satellite observation period. Both automated services deliver their results directly into a dedicated user workspace, ensuring timely access to newly processed data.
Users can complement these products with the Flood Depth Mapping service, available on demand, which estimates maximum water depth for selected events by combining FEM outputs with a Digital Elevation Model. By overlaying flood extent, flood frequency and flood‑depth maps with the static exposure layers provided in the operational workspace, users can interpret the magnitude and potential consequences of individual flood events and better understand the areas most prone to recurrent flooding.
Area of application: La Mojana (Colombia)
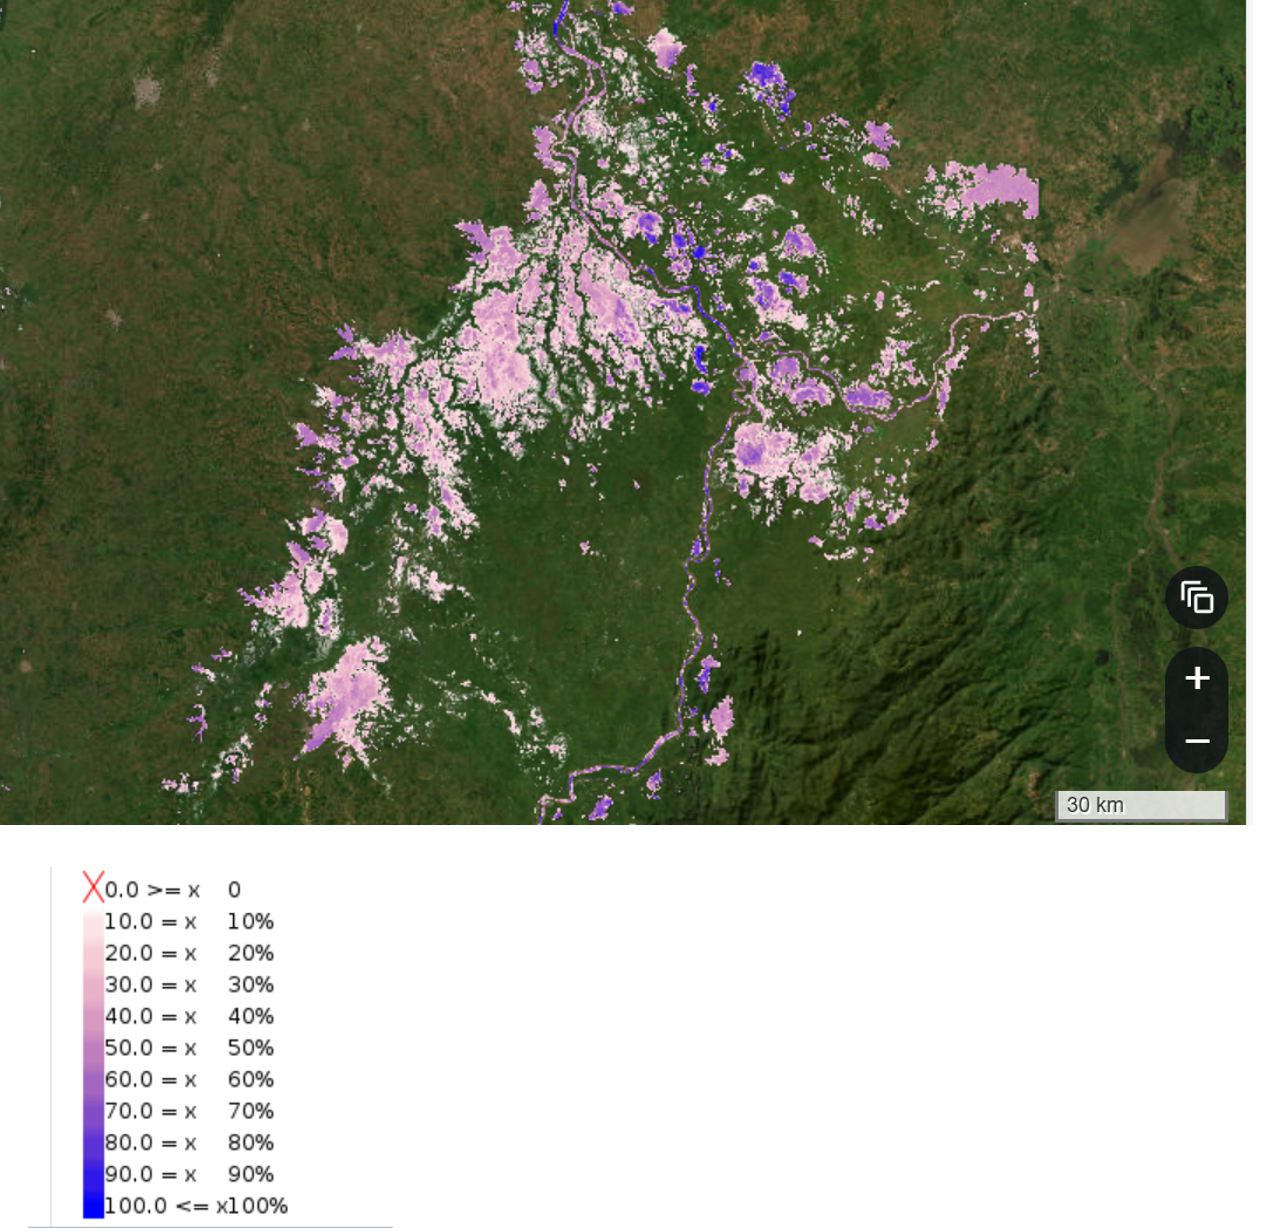
Flood frequency map in La Mojana region, Colombia. Legend: times the pixel got flooded, in percentage.