



In a world increasingly exposed to extreme events such as floods, fires, earthquakes and hurricanes, disaster risk reduction (DRR) has become one of the top global priorities. However, in order to make decisions with a comprehensive understanding of the context, it is necessary to know exactly what is at risk and what its value is.
To this end, Earth Observation is essential. Thanks to remote sensing, it is possible to monitor the Earth’s surface continuously, consistently, and on a large scale. This enables near real-time monitoring of the territory, at both local and global levels, whilst also facilitating integration with other data sources (such as economic databases) which enrich the analysis of exposure.
Within CopernicusLAC Panama Centre, two use cases have been developed which leverage geospatial technologies to build a comprehensive picture of risk exposure.
Population Distribution Mapping across the territory
The aim of this use case is to characterise the territory from a physical and demographic perspective, integrating different layers derived from Earth Observation data:
- World Settlement Footprint Tracker (WSF Tracker): delineates where settlements are located and how they evolve over time.
- World Settlement Footprint Imperviousness (WSF Imperviousness): measures the extent to which the ground is covered by artificial surfaces, which influences risks such as flooding.
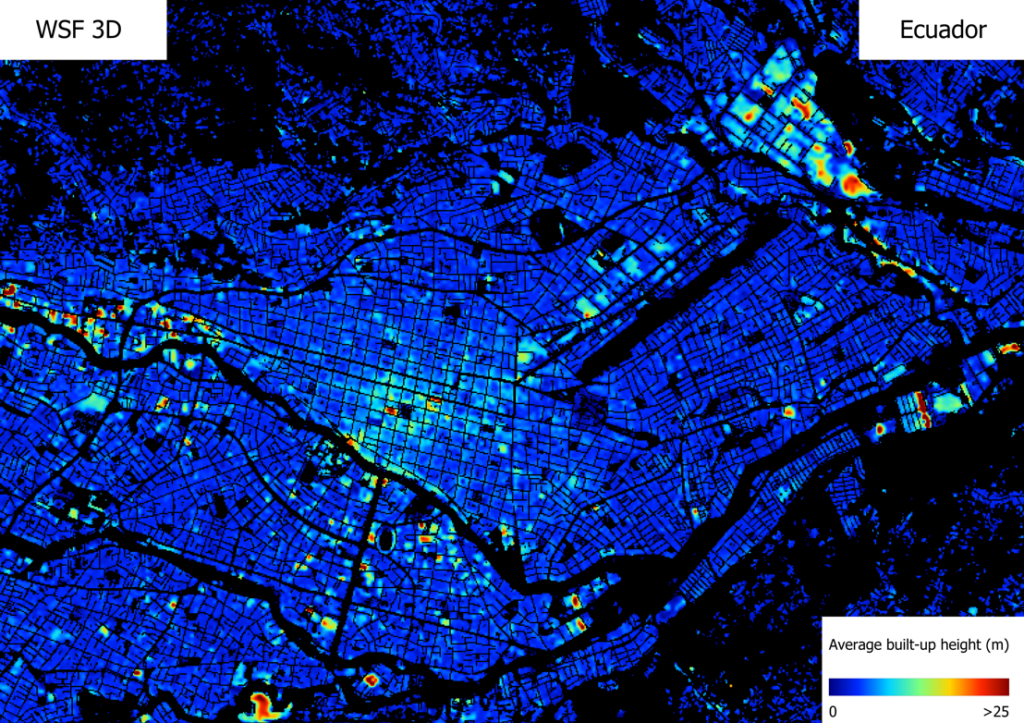
- World Settlement Footprint 3D (WSF3D): introduces the vertical dimension, ideal for assessing structural exposure.
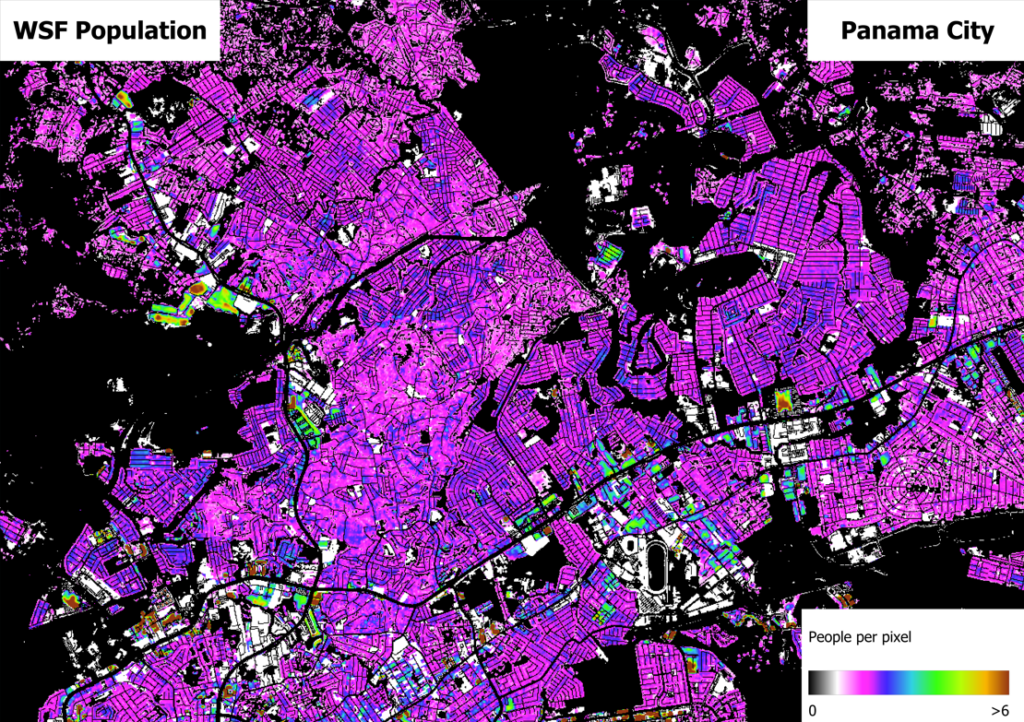
- Population distribution (WSF Population): a service that dynamically estimates population density by combining the above layers.
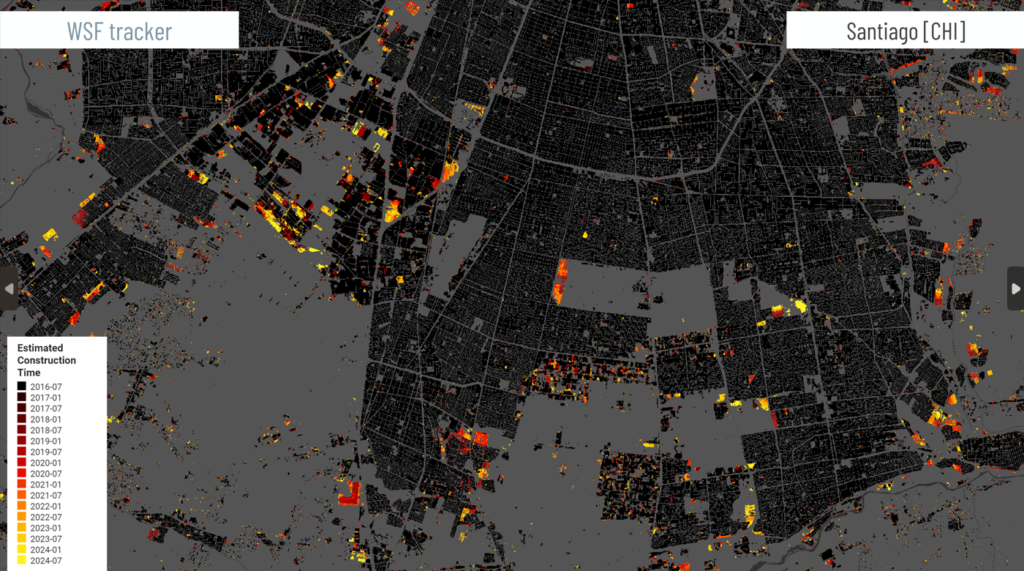
This provides a dynamic and detailed overview of physical exposure, identifying areas of unplanned urban growth, detecting areas with high population or building density, and analysing how the territory has evolved over time.
In regions of Latin America and the Caribbean, where urbanisation is rapid and often unplanned, having access to this information is crucial for anticipating risks and planning mitigation measures.
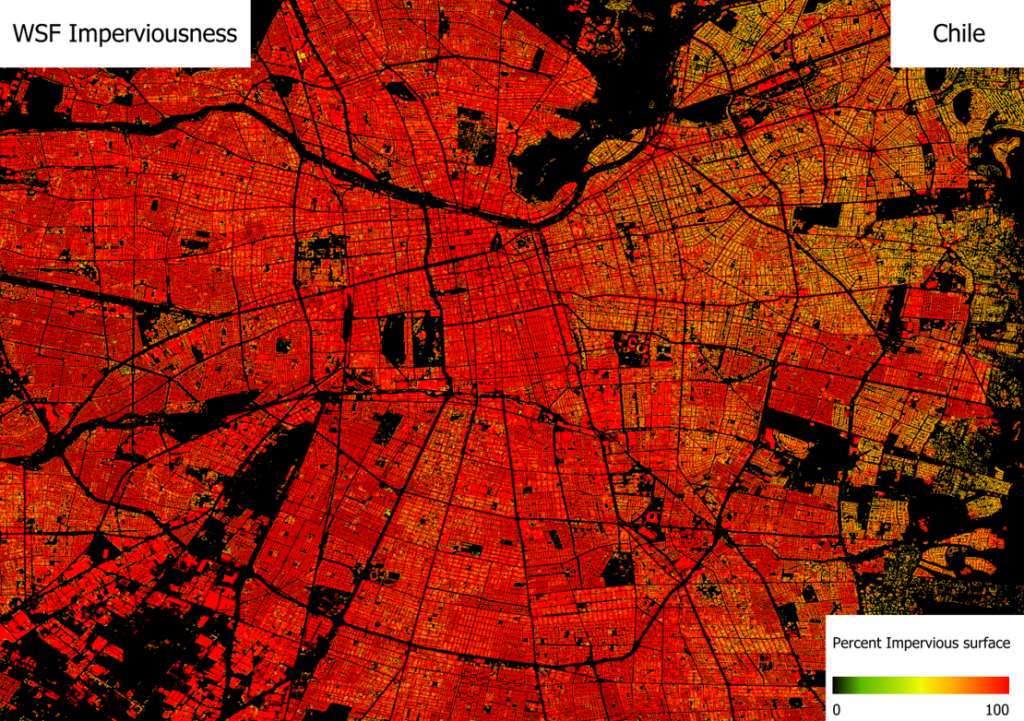
CopernicusLAC Panama offers these services in two formats: on-demand and on a half-yearly basis. By combining layers showing urban sprawl, imperviousness and building height with population data (whether global or provided by the user), the system generates both population density maps and estimates of the number of residents per building.
The first demonstrations with end users have already taken place, during which the effectiveness of the services was tested through their application to real-world cases such as the ones in Ecuador, Chile and Panama. These activities have enabled the Centre to validate results, analyse their applicability, and gather feedback to improve the models, with a view to continuing development and testing over the coming months.
Economic Value Mapping of exposed assets
This use case introduces a key dimension for disaster risk management: the Economic Value Mapping, through the generation of economic value maps per square metre.
To this end, land-use information is integrated with socio-economic data on prices, production and infrastructure, alongside data on population distribution and the characteristics of the exposed assets (such as construction materials and building types).
The process is based on two key components. Firstly, a detailed assessment of the territory is carried out, identifying the various land uses on the basis of Earth Observation data. Secondly, an economic value is assigned to each category, based on market data, production values, or replacement costs.
The use of these services therefore makes it possible to:
- Assess potential economic losses
- Prioritise critical areas for protection
- Plan investments in prevention
In short, it enables the assessment of potential economic impact of a disaster on a specific area.
Comprehensive disaster risk analysis
Combining the outputs of the two use cases enables the creation of a comprehensive, data-driven representation of risk, integrating the physical exposure of the territory with its economic exposure. Disaster risk is thus described in terms of the interaction between the territory, the population, urbanisation and the associated economic value.
These capabilities are enhanced by the ability to validate the results using local data and expert knowledge, which improves the accuracy of the services and facilitates their application in real-world contexts.
Thanks to Earth Observation technologies, this information can be obtained in a scalable, up-to date and accessible manner, facilitating decision-making by international organisations, public authorities, and other stakeholders involved in risk management. As part of its ongoing initiatives, the CopernicusLAC Panama Centre is driving this milestone to strengthen regional geospatial capabilities in Latin America and the Caribbean. By providing free access to Sentinel-1 radar and Sentinel-2 optical imagery, the objective is to enhance climate resilience and emergency preparedness.
Sign up for our newsletter by registering on the Digital Campus and follow us on social media to keep up to date with the Centre’s activities.
Background information
The activities of the CopernicusLAC Panama Centre fall within the overall context of the EU-LAC Digital Alliance, which is a strategic framework to promote cooperation between the European Union (EU) and the Latin America and Caribbean (LAC) region on digital and space issues under the umbrella of the EU Global Gateway strategy. In this context, the European Space Agency (ESA) coordinates the implementation of the Centre on the basis of a Contribution Agreement with the Directorate General for International Partnerships (DG INTPA) of the European Commission, and in close collaboration with the Government of Panama, the Ministry of Foreign Affairs (MIRE), the Government Innovation Agency (AIG), and the SENACYT (National Secretariat for Science, Technology and Innovation).